Compared to What?
The Integrity of Data Visualizations
If you have ever stared at a data set with misleading or just plain missing context, that begs the question: “COMPARED TO WHAT?” then you get it! If you have ever looked at a chart and wondered what the heck it was trying to convey, or went cross-eyed from too many competing and vibrating colors, textures, etc., which only hid the data, then you get it! We need chart integrity!
If you’ve known me for any length of time, you know this is a big. thing. for. me. And since we are in annual report season, I’ve been thinking about it a lot lately.
I leaned about the art and science of the integrity of data visualization was when I attended my first of several full-day seminars by Edward Tufte. Edward Rolf Tufte, sometimes known as "ET," and referred to as “The da Vinci of data,” (Deborah Shapley, The New York Times) is an American statistician and professor emeritus of political science, statistics, and computer science at Yale University. He is noted for his writings on information design and as a pioneer in the field of data visualization. At his seminars, I was exposed to the logic, intelligence, carefulness, and integrity of faithfully crafting graphics that accurately represented data. And when I read “The Visual Display of Quantitative Information,” I was hooked. This book has been recognized as one of Amazon’s “100 Best Non-Fiction Books of the 20th Century,” and is a definitive text on elegant solutions to complex data visualizations.
In it, ET explains and give examples of his theories of graphical excellence including these principals on Data-Ink:
Above all else, show the data;
Maximize the data-ink ratio;
Erase non-data-ink;
Erase redundant data-ink;
Revise and edit.
He goes on further to banish “chart junk’!
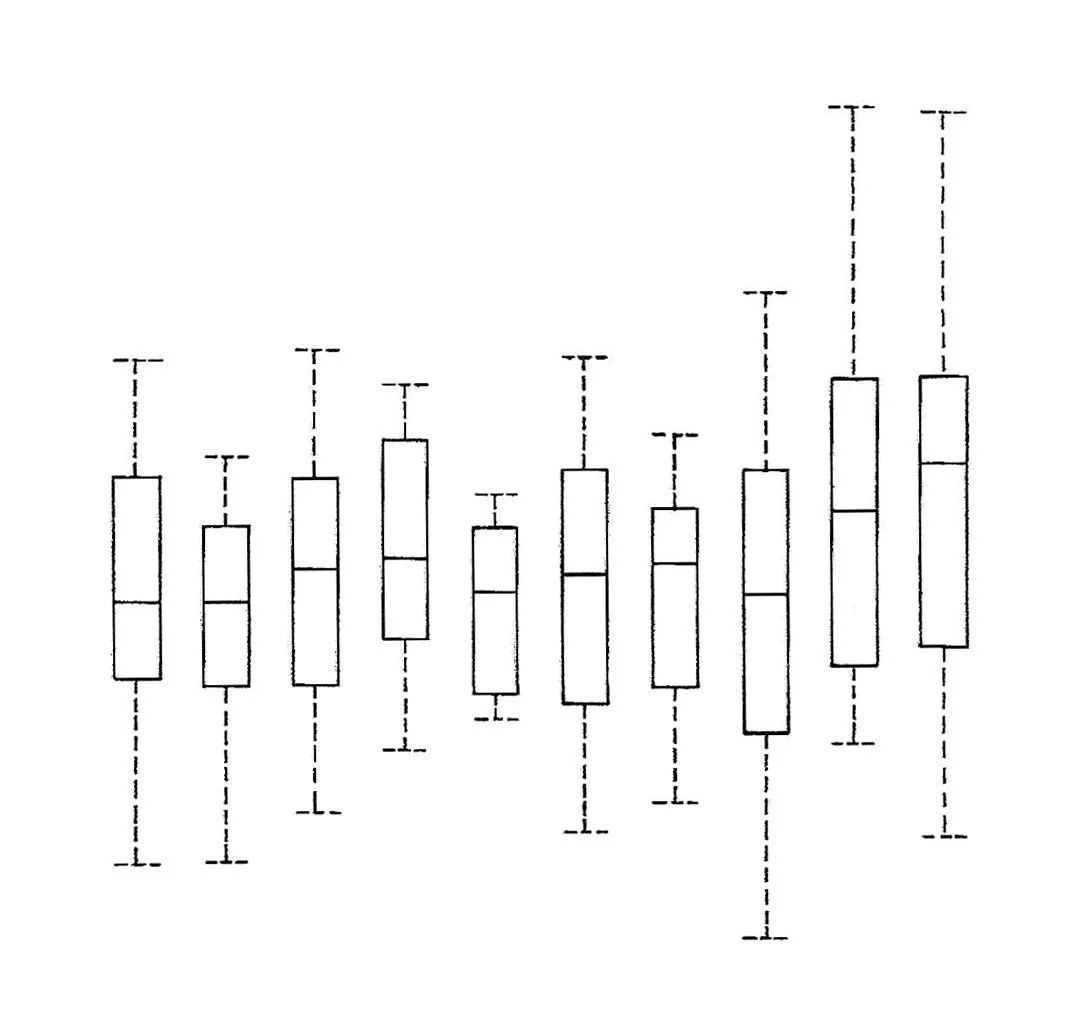
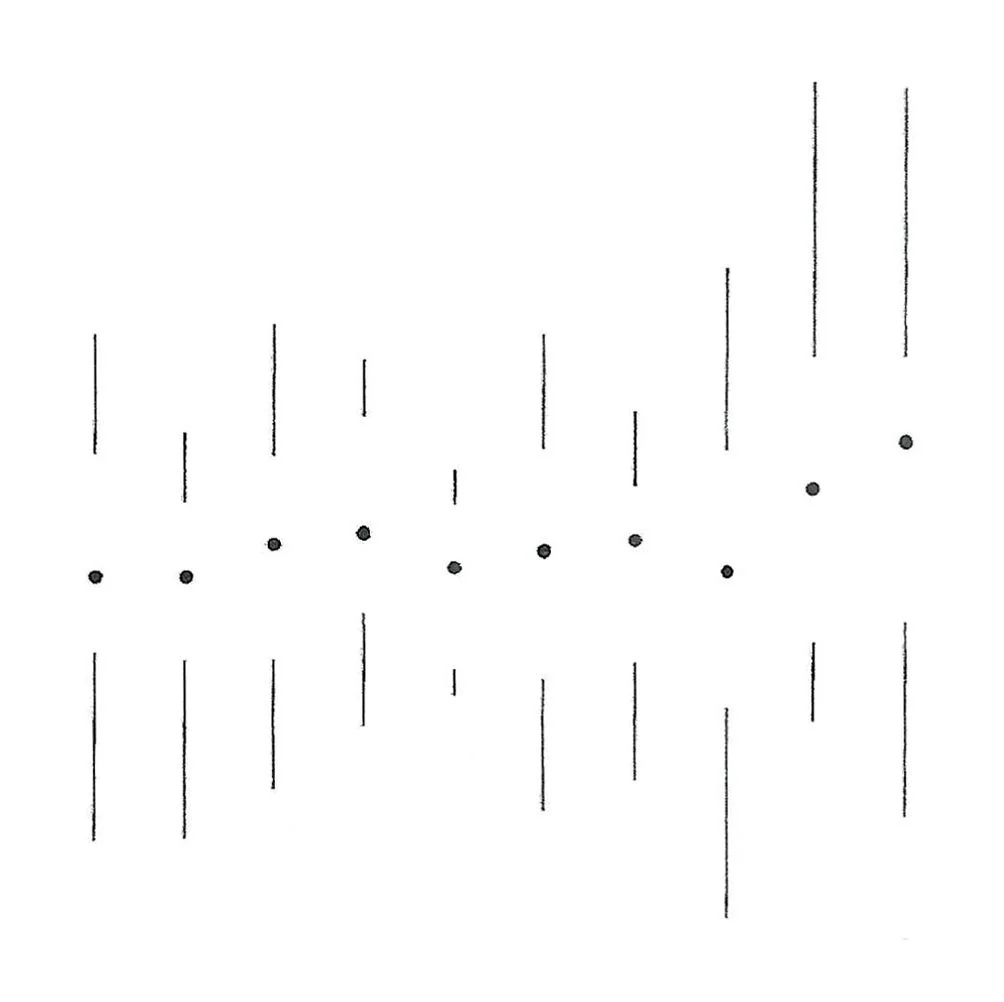
Above: Data-Ink Maximization, Edward Tufte, The Visual Display of Quantitative Information (Cheshire, Connecticut) © 1983, p. 125.
In this elegant example of data-ink maximization, 80 separate lines in the original on the left, have been reduced to only 10 verticals, knocked out by 10 dots to show the same information. Brilliant.
My hope is that we as designers can strike a balance between the integrity of the charts we create and the appreciation of our clients during this annual report season.
Happy Charting!
P.S. For more on chart junk- check this out.
Tufte's Chart Junk Notebook